Main Screen
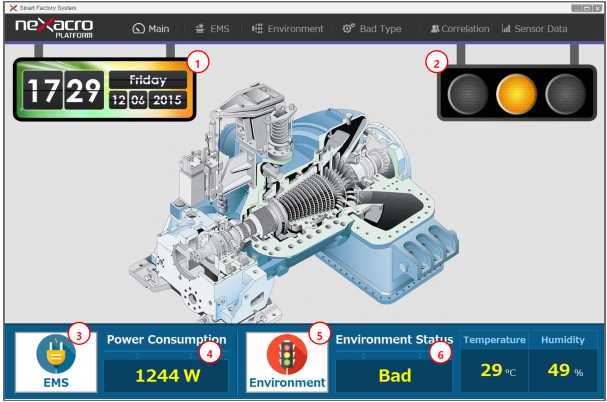
Description of Main Screen:
- Displays current date and time
- Displays status of current environment and temperature standards:
- Below 0 DANGER zone
- 0-17 BAD zone
- 18-28 GOOD zone
- 29-33 BAD zone
- Above 33 DANGER zone
- Moving to EMS Screen
- Displaying power consumption
- Moving to monitoring environment screen
- Displaying environment monitoring status, temperature, humidity
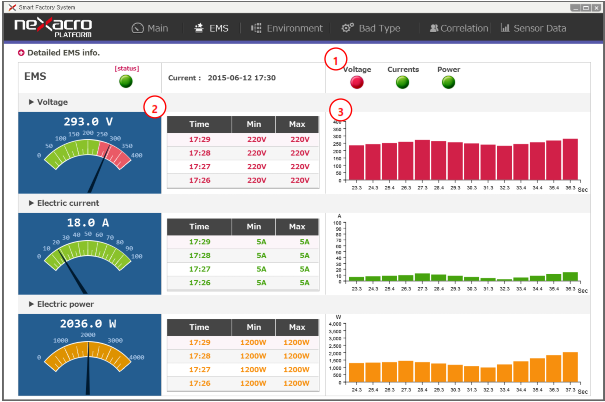
EMS Screen
Description of EMS Screen:
- Displaying current status of Voltage, Currents and Power
- Display voltage status: If exceeds 250 voltage button will become red, otherwise remains green
- Display current status: If exceeds 80 current button will become red, otherwise remains green
- Display status of power: If exceeds 3000 power button will become red otherwise remains green
- Displays Gauge chart for Voltage, Electric current and Electric power.
- Updates status every second
- Displays Bar chart for voltage, current and power
- Updates status every second
Monitoring Environment Screen
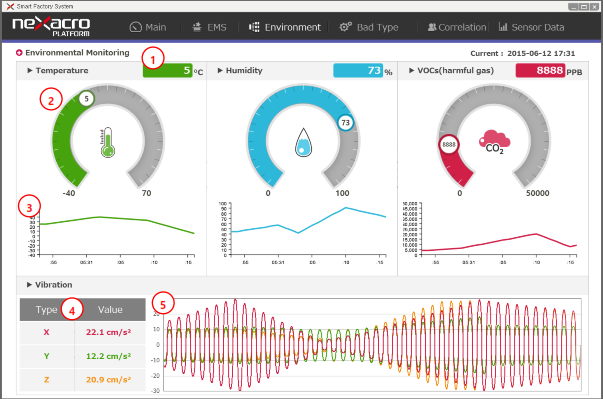
Description of Monitoring Screen:
- Displays current status of temperature and humidity of VOCs
- Displays temperature, humidity of VOCs Gauge Chart
- Updates every second
- Display line chart of temperature, humidity of VOCs
- Updates every second
- Shows values of X, Y, Z variables
- Shows variation chart of X, Y, Z
- Updates every 0.5 seconds
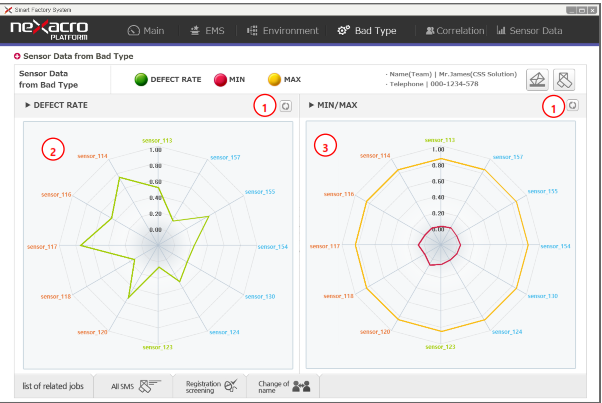
Screen for Defect Status
Description of Defect Screen:
- Defect rate for data, updating process for maximum and minimum value
- Radar chart of defect rate data
- Radar chart of maximum and minimum value
Relationship screen
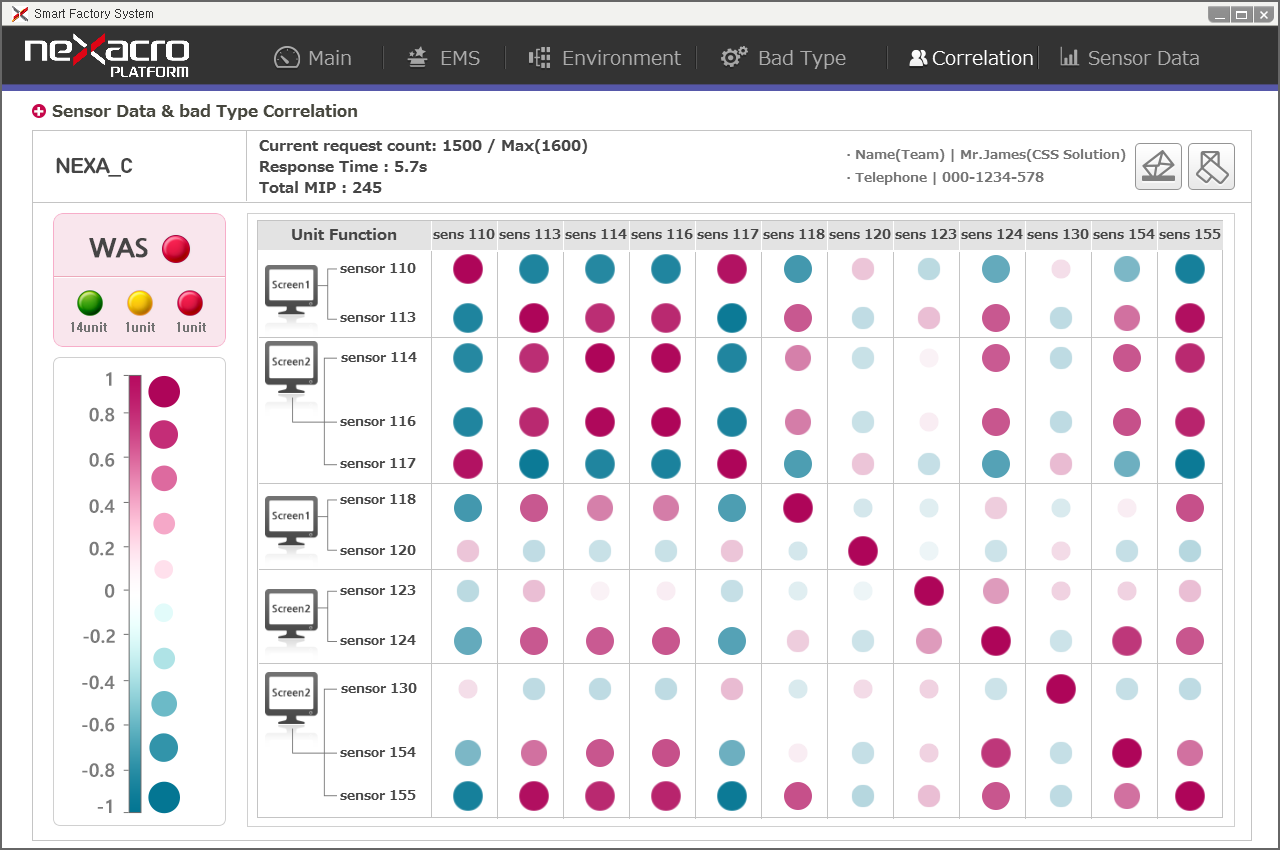
Description of Relationship Screen:
- Displays relationship between sensor data and defect rates
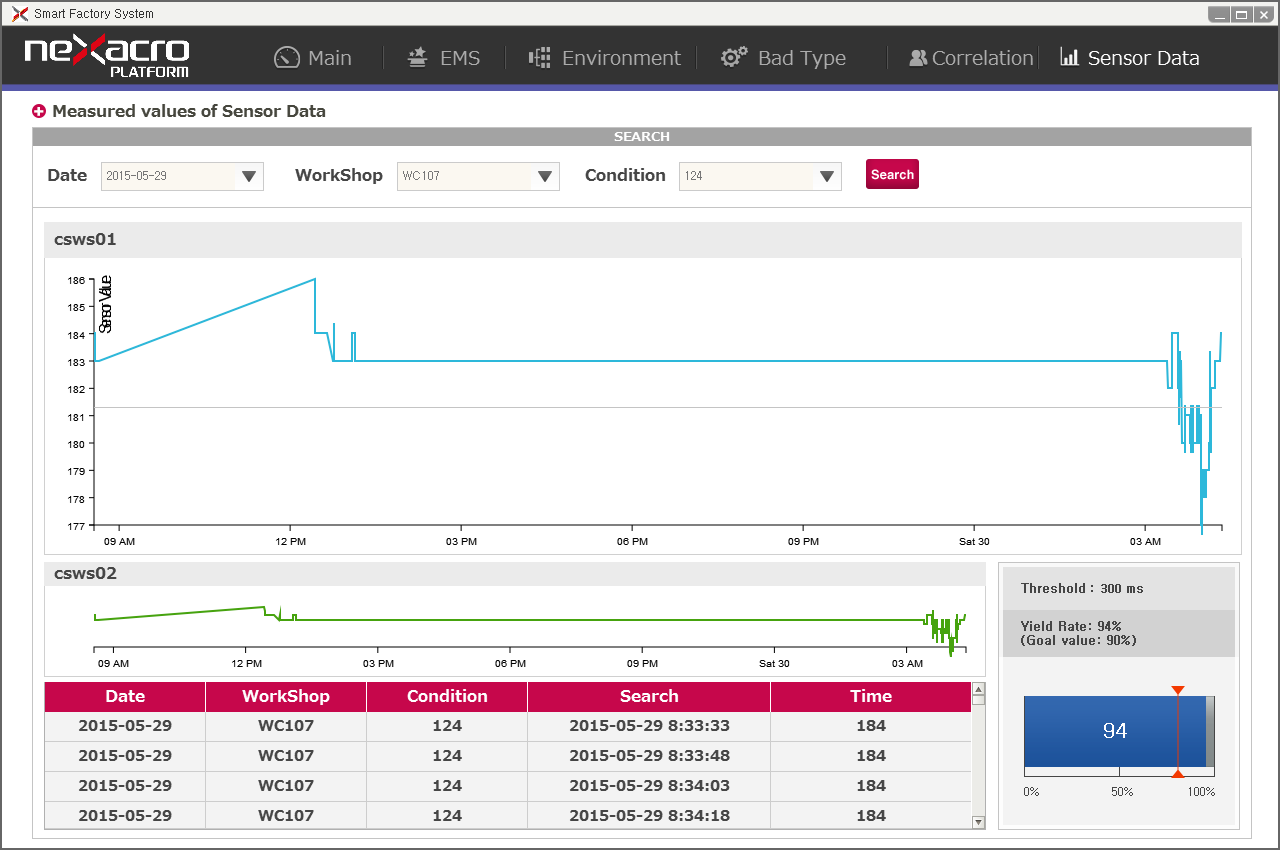
Sensor Data Screen
Description of Sensor Data Screen:
- Process data search by Date, WorkShop, Condition’s value
- Displaying the line chart measured values of sensor reader’s data values
- Briefly display the measured real time values, received by data sensors
- Displays measured values by Date, Workshop, Condition
- Shows percentage values for value ratio